Your agent shipped it.This caught what it broke.
A quiet performance instrument for the AI-built frontend. It runs in the corner, watches for jank, leaks, DOM bloat, layout shift and failing audits — and hands the evidence straight to your coding agent.
The widget in the bottom-right corner is live — it is measuring this page right now.
The pain, named in one breath
your TuesdayAI agents ship frontends that pass review and look fine in the happy path — then leak memory across route changes, bloat the DOM to 10k nodes, fire the same request eight times, jank on scroll, shift layoutas things load, and quietly fail Core Web Vitals and SEO. Nobody is watching, because the person who “wrote” it was an agent and the human never opened DevTools.
VibeCheck is the observer that was missing— a performance conscience for your coding agent. It watches what the agent builds, and when something is wrong it doesn’t just nag you: it tells the agent, in the agent’s own language (MCP), with the exact evidence.
Break this page
the live proofThese are not mockups. Each button induces a realfault in this page; the instrument in the corner catches it in real time. When you’re done, reset it — nobody is left on a degraded page.
Always measuring
the live layerBefore it catches anything by name, the instrument is simply measuring— continuously, in the corner. Below are this page’s real readings right now, off the same collectors the widget ships: frame health, main-thread long tasks, JS-heap memory and the Core Web Vitals. Not a mockup — a live readout.
That’s the measurement layer — six of the signals it watches without pause. On top of it, the instrument catches thirteen named regressions when those readings go wrong. Meet them:
The Slop Bestiary
what it catchesThirteen recurring frontend regressions that AI agents ship without noticing — each one a specimen the instrument catches by name. Hover a card for the field note: how it slips in, and the exact issue string it logs when it does.
Always room for one more wrapper.
The agent solves every layout with another div — a flex shell here, a "container" there, an outer wrapper "just for spacing" — and never unwraps a single one. The layers stack like nesting dolls until querySelectorAll('*') sails past 800, then 1,500, and every style recalc and layout pass has to drag the whole swollen tree behind it.
Once was never going to be enough.
Born from a StrictMode double-render into a codebase with no cache, it fires the identical GET on every re-render and keystroke — no dedupe, no memo. Four copies of the same request land before the first response does, and on a POST it cheerfully submits the order twice.
console.log('here'). And here. And here.
The agent scaffolds a component, sprinkles console.log('here') to check the wiring, and swears it will clear them before shipping. It never does, so the logs ride to production — fifty-plus calls every ten seconds, narrating every render and fetch to a console no user will open, and leaking whatever you passed in to anyone who hits F12.
I keep everything you forget to clean up.
The agent writes addEventListener with no removeEventListener, effects that return no cleanup, intervals nobody clears — so every remount stacks another ghost subscription on the last. The heap climbs in a staircase, five megabytes at a time with no GC dip, hoarding detached nodes and stale closures until the tab runs itself out of memory.
Read one pixel? Enjoy the reflow.
It rides the tidy-looking loop the agent wrote: read offsetHeight, set a style, read the next element's offsetTop, set another — each read forcing a full re-measure of the layout the last write just dirtied, dozens of times a frame. Then it ships images with no width or height, so the page lurches as they load and the button jumps the instant your thumb commits.
Ships a billboard to fill a thumbnail.
It drops the full 4000-pixel export straight into a 400-pixel slot — no resize, no srcset, no width or height, because none of that was in the prompt. The browser downloads every last pixel, crushes them into the box, and shifts the layout on the way down. Flawless on the agent's fiber; a mugging on mobile data.
Shipped it full-res. The network can cope.
The agent needed a hero, grabbed a four-megabyte stock JPEG, and dropped it in untouched — no WebP, no compression, no second thought. It looks perfect on the fiber connection and the Retina mock, then a real person on 4G downloads all four megabytes to watch one banner paint a row at a time.
One thread. I'm loafing on it.
The agent crammed the whole parse-sort-and-render into the click handler — synchronous, never yielding — so the frame that owed you a response just sits there for 200ms. The click registered; it simply couldn't be bothered to paint. LoAF names the exact file and blocking time, which is how you learn the culprit is the bundle nobody split.
Why tree-shake when you can ship the forest?
One date needed formatting, so it shipped all of moment.js, the whole of lodash, and an icon set of four thousand glyphs to render three — the network tab never once opened. It weighs every JS and CSS payload as it crosses the wire and flags the ones that blow the page-weight budget. Invisible on office fiber; a five-second white screen on a commuter's phone.
All 67 locales aboard. You'll use one.
Trained on a decade of tutorials that imported the full lodash and reached for moment by reflex, the agent does the same: npm i moment to format one timestamp, all of Ant Design for a single button. It never announces itself — it just leaves fingerprints across the global scope (window._, window.moment, a chart.umd.js in the network tab) until the bundle analyzer reads like a crime scene.
The <body> shipped. Nobody opened the <head>.
The agent builds a flawless component tree and never once opens index.html, so the document head stays a hollow shell — no favicon, no viewport, no lang, no charset. The dev server's headers and your desktop width paper over it locally, then it ships: a blank tab icon, a phone rendering at 980px, and "café" turning into "café." Four one-line fixes, none of them written, because boilerplate isn't a feature nobody prompts for.
Twenty boxes. You ticked four.
It waits for the SPA to finish rendering, then walks the <head> with a clipboard — title, meta description, canonical, og:image, robots — twenty checks, each a cold pass or fail. The agent shipped <title>Vite + React</title> untouched and never wrote an og:image, so every tab is anonymous and every shared link previews as a blank grey box. It also finds the stray noindex someone pasted from a tutorial, quietly telling Google the page was never born.
Renders for people. Reads as blank to the bots.
The agent ships a page that only exists after JavaScript runs — no text in the raw HTML, no JSON-LD, no llms.txt, and a robots.txt that waves GPTBot and ClaudeBot off at the door. Humans see a polished site; an answer engine fetches it, finds an empty shell it can't parse or cite, and leaves. So ChatGPT recommends your competitor and has never heard of you.
Grade this very page
Two of those detectors — seo and aeo— run as pass/fail audits. Point them at the page you’re on and see the honest score, misses and all:
Got a site of your own? Scan any URL → and see what Google and the answer engines actually get.
From symptom to fix
the round-tripThe widget captures a snapshot, beacons it to a local MCP server, and your agent reads it — then proposes the diff. The loop that was missing from vibe coding:
This is the actual loop running against installable package tarballs: the widget catches DOM bloat, one agent leases the project, and the issue crosses the MCP bridge only when you click send.
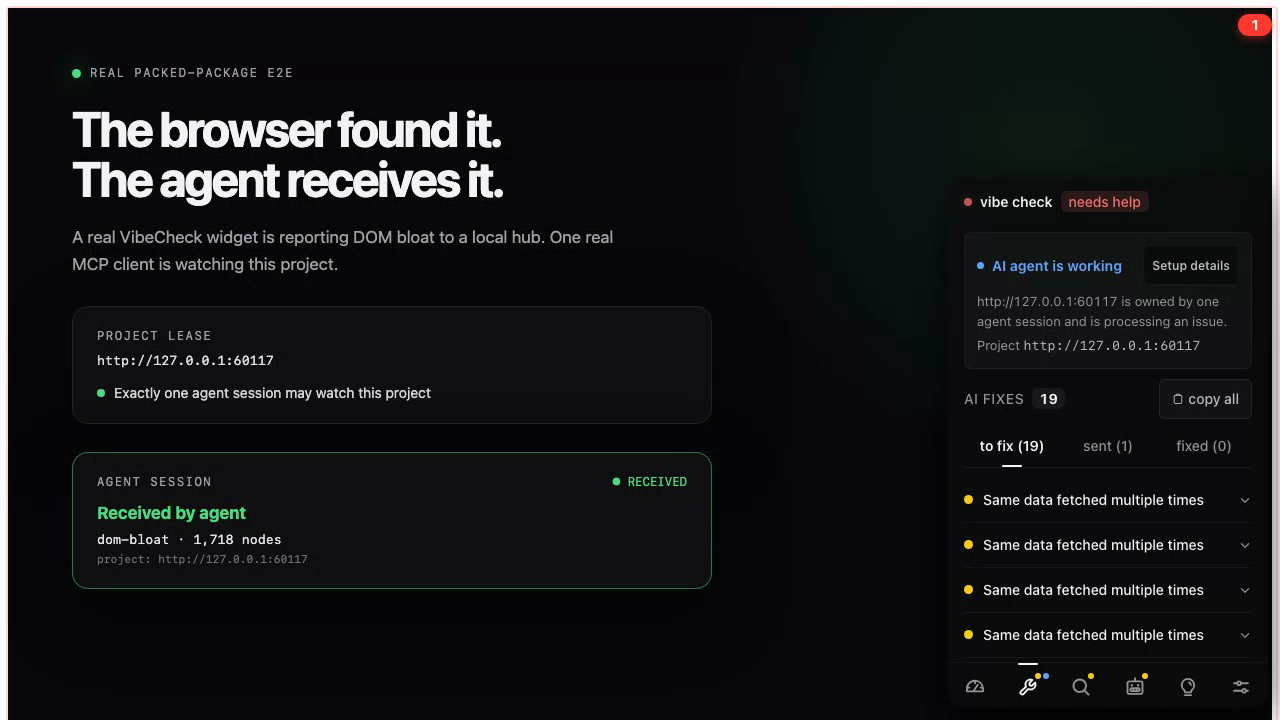
Then the agent can use the evidence to propose a diff and close the issue. Here is that longer repair conversation as an illustrative transcript:
Ask your agent: What is VibeCheck detecting right now, and how do I fix it?
Install & wire up your agent
two blocksDrop in the widget
import { VibeCheck } from '@wcgw/vibe-check'

{process.env.NODE_ENV !== 'production' && (
  <VibeCheck
    beaconUrl="http://127.0.0.1:4200"
    projectId="my-project"
  />
)}
Connect your coding agent
# Run once in a terminal
npx -y @wcgw/vibe-check-mcp@0.3.0 hub

# Register the bridge with your agent
claude mcp add vibe-check -- npx -y @wcgw/vibe-check-mcp@0.3.0 connect
Nine project-scoped MCP tools, an llms.txt, and a Claude skill ship in the box. Read the 5-minute quickstart →